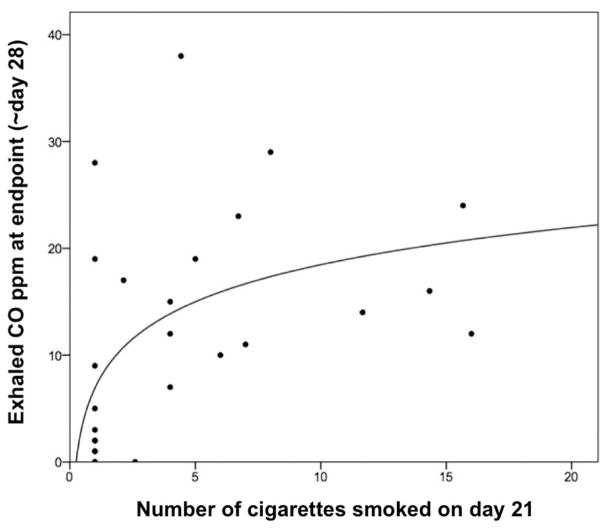
Figure 1.
The natural-log relationship between EMA-calculated smoking on Day 21 and exhaled CO at the endpoint assessment approximately one week later. The logarithmic relationship is significant (F1,24= 8.00, p < .01), and corresponds to a significant linear correlation between log-transformed EMA-calculated smoking and CO (r = .50, p < .01).

