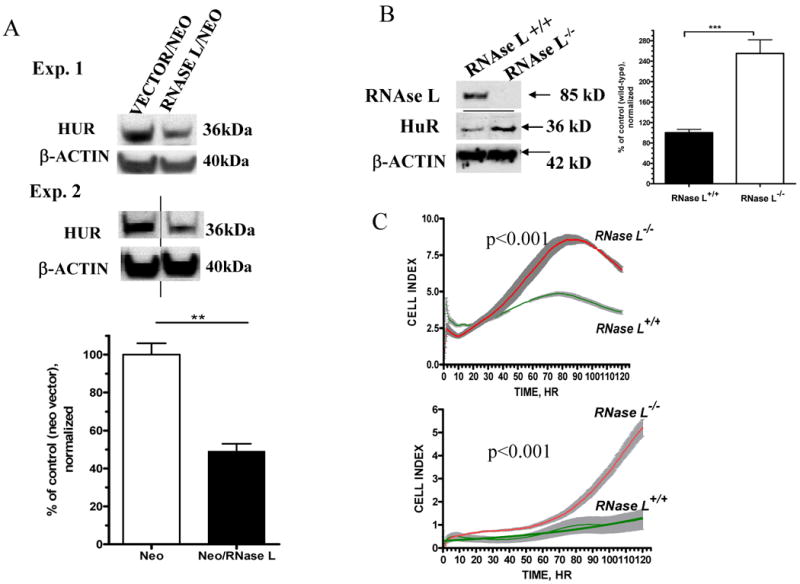
Figure 2. Effect of RNase L over-expression and knockout on HuR and cellular growth.

(A) Equal amount of proteins extracted from confluent cells that stably express neomycin vector or RNase L/neomycin were analyzed by Western Blotting using anti-HuR and anti-β-actin. Data shown are two representative experiments of three. Lower panel showed quantitation of β-actin normalized signals (Mean ±SEM) of HuR from three independent experiments. ** denotes p<0.01 using student t-test statistic.
(B) Equal amount of proteins extracted from confluent MEFs generated from wild type or RNASEL-knockout mice were used for Western blotting (anti-mouse RNase L, anti-HuR and anti-β-actin). Right panel showed quantitation of β-actin normalized signals (Mean ± SEM) of HuR from three independent experiments. *** denotes p<0.001 using student t-test statistics.
(D) Growth curve of RNASEL-knockout and wild type MEFs. Cells were seeded in a 96-well plate with 5000 cells (upper panel) or 2500 cells per well (lower panel). Cellular growth monitoring and statistics were performed as described in (Fig. 1A).
