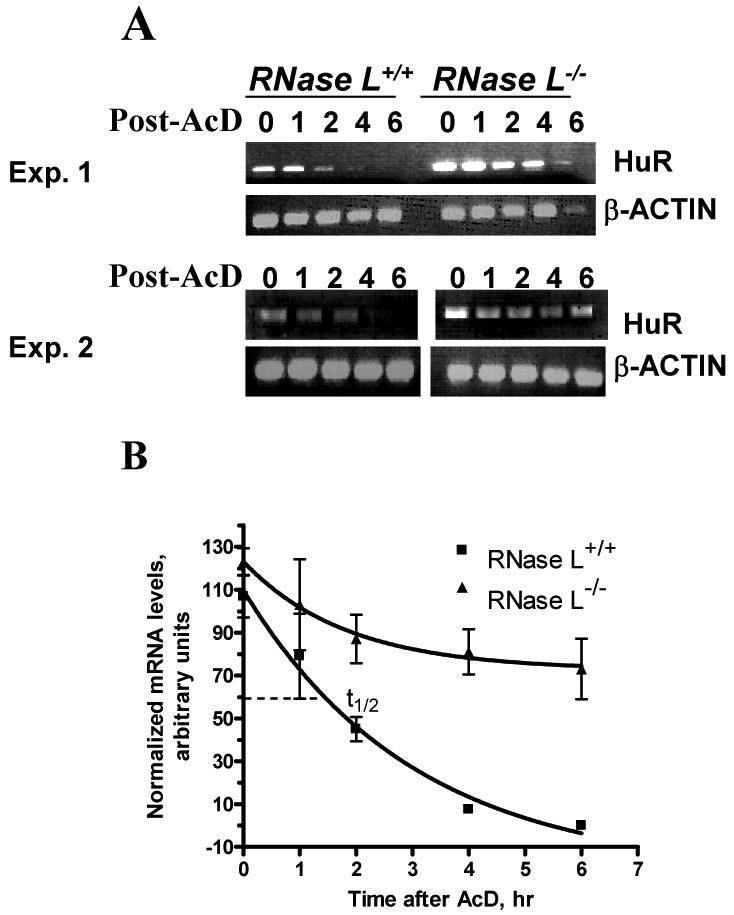
Figure 3. Effect of RNase L on HuR mRNA.

(A) RNase L-/-and RNase L+/+ MEFs were treated with medium control (0 time point) or actinomycin D (5 ug/ml) for various times, as indicated. Semi-quantitative PCRs were performed with primers specific to HuR and β-actin cDNA. PCR, with cycle number that allows at least semi-quantitative comparison, was used as described Materials and Methods. Gels shown are from two independent experiments.
(B) Signal intensities on gels from Fig. 3A were quantified. One-phase exponential decay curves for relative mRNA half-life measurements in the two cell types are shown. Density units (minus background) are plotted as a function of time after the addition of actinomycin D. Detail of the model is given in Materials and Methods.
