
Figure 6. Nuclear/cytoplasmic distribution of RNase L.
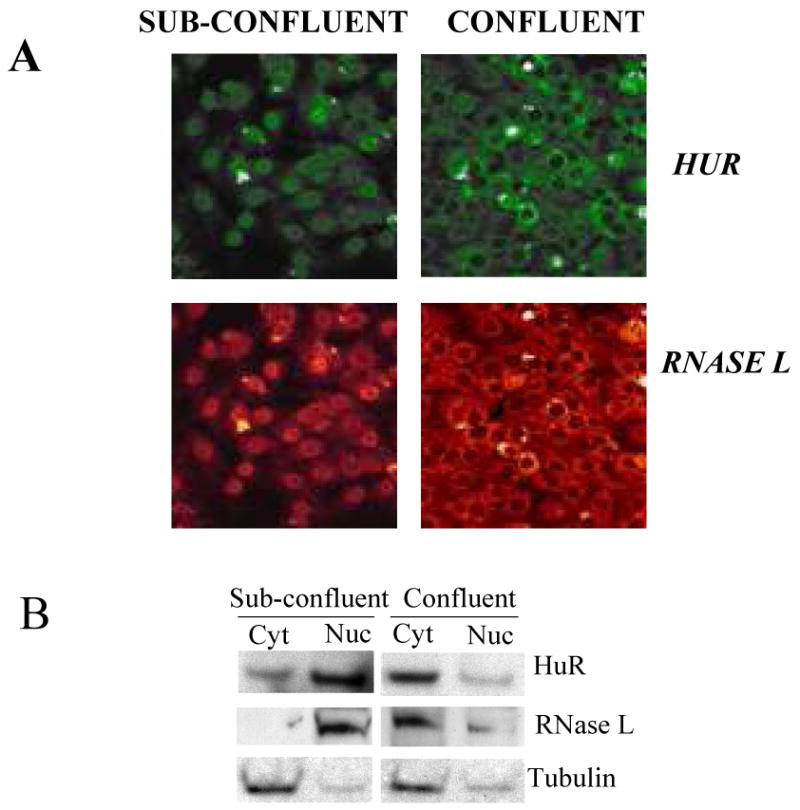
(A) Huh-7 cells, which constitutively express immunofluorescently detectable levels of RNase L, were seeded on cover slips with two different densities to allow cells to reach either sub-confluent (∼40%) or confluent stage the next day. Cells were stained with anti-RNase L or anti-HuR followed by secondary antibody that is either FITC-conjugated (green color, HuR) or TRITC-conjugated (red color, RNase L) for confocal visualization.
(B) Huh-7 cells were seeded with two different densities to allow cells to reach either sub-confluent (∼40%) or confluent stage the next day. Nuclear and cytoplasmic extracts were subjected to Western blotting using antibodies to RNase L, HuR, and tubulin (cytoplasmic control) to confirm the findings in A. The blot is one of two (RNase L) and three (HuR) independent experiments.