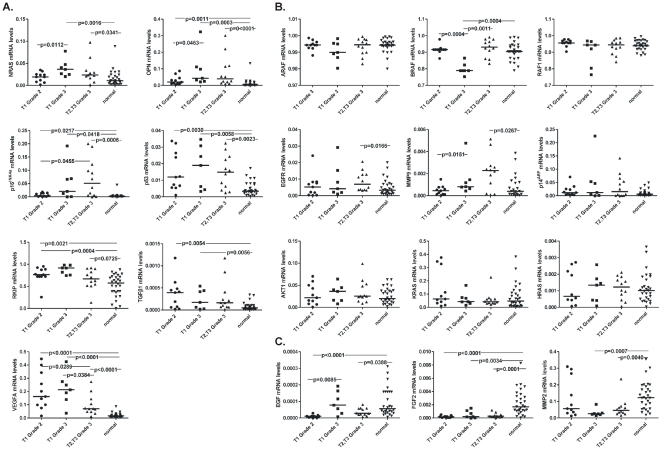
Figure 4. Scatterplot depicting the mRNA levels of the genes that were over-expressed in various urinary bladder cancers of different stage/grade, versus normal tissue.
Groups pairs were statistically compared using the Mann-Whitney U test. Bars depict the median values (A). Scatterplot depicting the mRNA levels of the genes that were equally expressed among urinary bladder cancers of various stage/grade, and normal tissue. Groups pairs were statistically compared using the Mann-Whitney U test. Bars depict the median values (B). Scatterplot depicting the mRNA levels of the genes that were under-expressed in various urinary bladder cancers of different stage/grade, versus normal tissue. Group pairs were statistically compared using the Mann-Whitney U test. Bars depict the median values (C).

