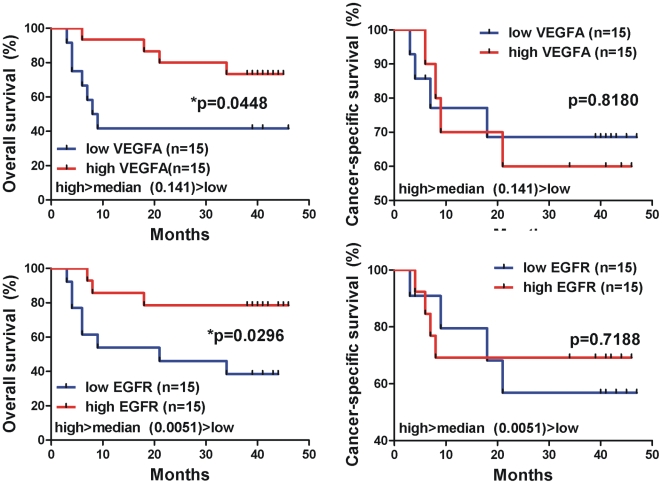
Figure 6. Kaplan-Meier curves depicting overall survival (%) of the urinary bladder cancer patients, regarding the mRNA expression of the GOIs.
The cases whose tumors exhibited low levels of VEGFA (<median value, 0.141) and EGFR (<median value, 0.0051) mRNA expression, exhibited worse overall survival rates, than the cases expressing increased VEGFA (>median value, 0.141) and EGFR (>median value, 0.0051) mRNA levels [for VEGFA, p = 0.04; for EGFR, p = 0.02; Log-rank (Mantel Cox) test]. Differences in survival were assessed using Log-rank (Mantel Cox) test. Statistical significance was set at the 95% level (p<0.05).

