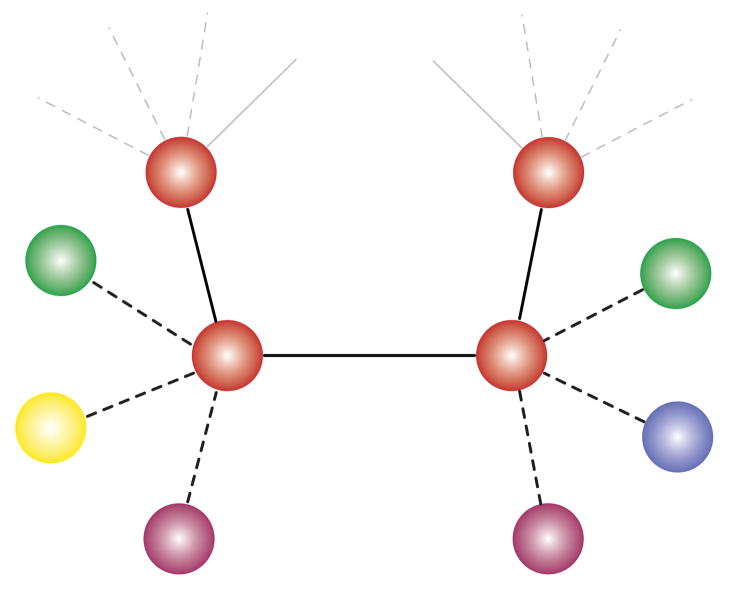
FIG. 1. Illustration of Genotype-Phenotype Model.
A schematic representation of the genotype-phenotype map used in our analysis. Each circle corresponds to a genotype; colors denote phenotypes. The model parameter q quantifies robustness: a proportion q of mutations are neutral (solid lines), and the remaining mutations are non-neutral (dotted lines). A non-neutral mutation changes an individual’s phenotype to one of the K accessible alternatives that form the individual’s phenotypic neighborhood. When K is smaller than the total number of alternative phenotypes in the landscape, P, then individuals may have different phenotypic neighborhoods. The central pair of adjacent genotypes shown here express the same phenotype, but they have different phenotypic neighborhoods.

