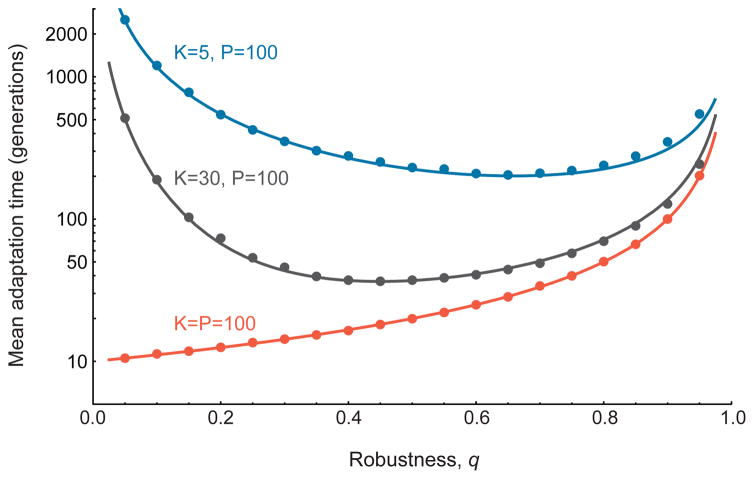
FIG. 2. Robustness and Adaptation Time.
The relationship between robustness, q, and the average waiting time before the arrival of a specific beneficial mutation, for three fitness landscapes. Points show the means of 10,000 replicate Monte Carlo simulations, and lines show our analytic predictions (see Box 1 and SI sec. 1). When all possible phenotypes in the landscape are directly accessible by a mutation from any genotype (i.e. when K = P), robustness always inhibits adaptation (red curve). However, when phenotypic neighborhoods are small (i.e. when K<P), neutral mutations have epistatic consequences and the resulting relationship between robustness and adaptation time is non-monotonic: adaptation is most rapid at intermediate levels of robustness. N = 10,000, μ =0.001, P = 100.

