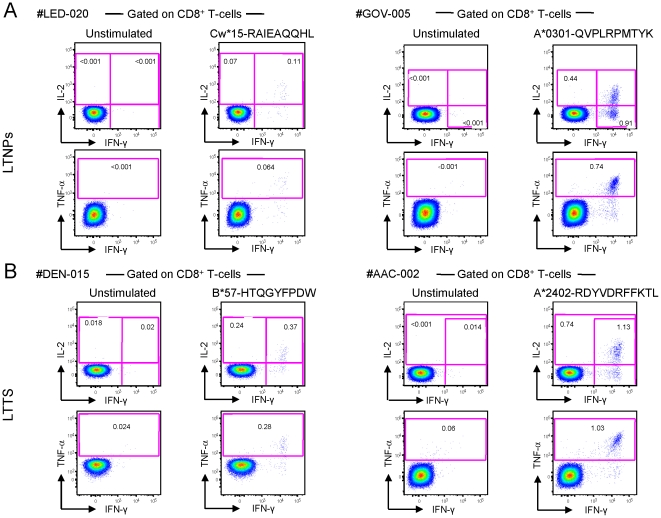
Figure 2. Flow cytometry profiles of HIV-1-specific CD8+ T-cells. (A.
) Shown are two representative flow cytometry profiles of HIV-1-specific CD8+ T-cell responses from two LTTS subjects: left panels from subject #LED-020 (stimulation with a gp41 epitope, aa 46–54) and right panels from subject #GOV-005 (stimulation with a nef epitope, aa 73–82). (B) Shown are two representative flow cytometry profiles of HIV-1-specific CD8+ T-cell responses from two LTNP subjects: left panels from #DEN-015 (stimulation with a nef epitope, aa 116–124) and right panels from #AAC-002 (stimulation with a p24 epitope, aa 162–172). IL-2, TNF-α and IFN-γ production was measured upon 6 hours of in vitro stimulation with optimal HIV-1 peptides. LTTS: long-term treated HIV-1 seroconverters; LTNPs: HIV-1 long-term non-progressors.

