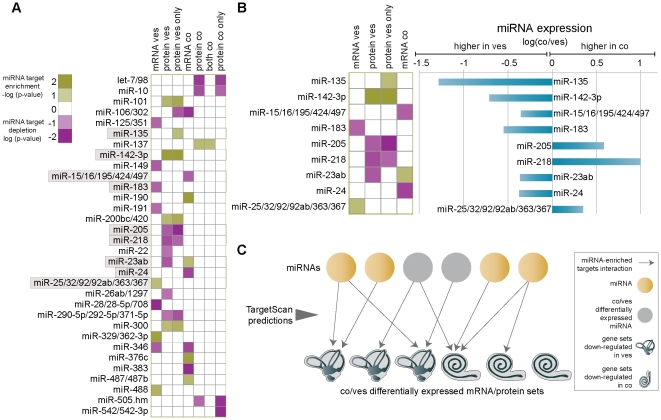
Figure 2. miRNA target identification by integration of mRNA and protein expression with in silico target prediction.
(A) Enrichment and depletion of miRNA targets in co-expressed clusters of mRNAs, proteins, both or proteins only down-regulated in either the cochlea or vestibule. Green squares indicate over-representation of miRNA targets in a cluster and purple squares indicate under-representation. Only miRNA-target cluster pairs with P<0.05 are shown. miRNAs shown in figure 2B are labeled by a grey box. (B) Differentially expressed miRNAs with significant target enrichments and depletions. (Left) Enrichment and depletion of miRNA targets in the co-expressed clusters for miRNAs that showed differential expression based on the miRNA array. (Right) The relative expression of the miRNAs on the left represented by the log of the ratio between the expressions in the cochlea as compared to the vestibule. (C) An outline of our miRNA target identification approach. Circles represent miRNAs and cochlea/vestibule cartoons represent mRNA/proteins sets that are differentially expressed between the two tissues. Arrows connect miRNA with mRNA/protein sets that are significantly enriched with its predicted targets based on TargetScan predictions. Only miRNAs that have enriched predicted targets in the differentially expressed gene sets are presented. Cases where a miRNA is differentially expressed between the two tissues (shown in B) are marked by a grey circle, while other cases are marked by a brown circle. Abbreviations: co-cochlea; ves-vestibule.

