Figure 4.
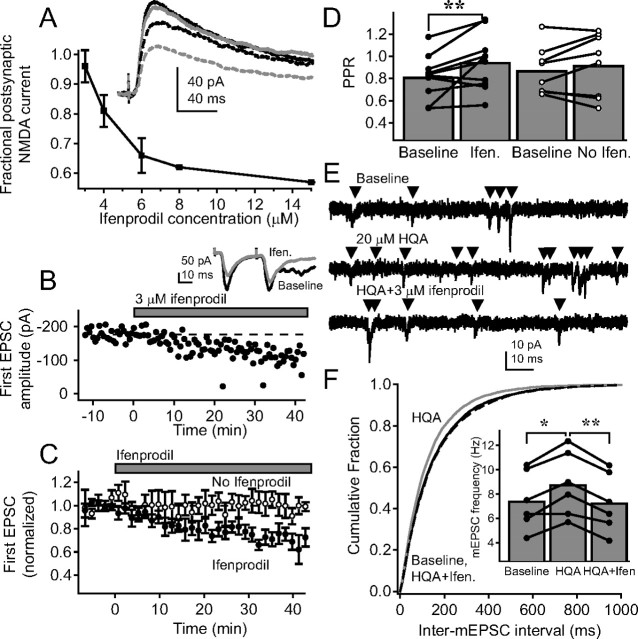
PreNMDARs preferentially contain NR2B subunits. A, Blockade of pharmacologically isolated postsynaptic NMDA-mediated EPSCs by increasing ifenprodil concentration. Inset, Representative traces from a single cell during baseline (solid black), 3 μm (solid gray), 4 μm (dashed black), and 6 μm ifenprodil (dashed gray). B, Effect of 3 μm ifenprodil on amplitude of the first EPSC for a representative cell. Inset, Pairs of EPSCs before (black) and during (gray) 3 μm ifenprodil. Each trace shown is the average of the last 10 sweeps of each condition. C, Group data for cells with 3 μm ifenprodil application (n = 10, filled circles) and for control experiments without ifenprodil (n = 8; open circles). D, Change in PPR for 3 μm ifenprodil application (filled circles) and control (open circles). Error bars represent population means. **p < 0.01. E, Representative mEPSCs from a single L2/3 pyramidal neuron during baseline, 20 μm HQA application, and 20 μm HQA plus 3 μm ifenprodil. F, Mean cumulative probability histogram for inter-mEPSC interval during baseline (solid black), HQA (gray), and HQA plus ifenprodil (dashed black; p < 0.01 for baseline vs HQA and for HQA vs HQA plus ifenprodil; p > 0.05 for baseline vs HQA plus ifenprodil, Kolmogorov–Smirnov test). Inset, Mean frequency for each cell during each condition. Error bars represent population mean. *p < 0.05; **p < 0.01.

