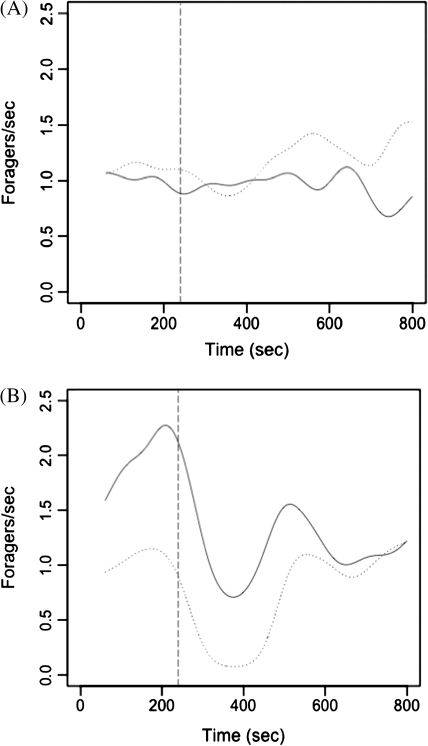
Figure 1.
Response to change in forager return rate. Shown are smoothed results for 2 trials, each for 1 colony on 1 day. Rates of foraging were smoothed using a Gaussian kernel. Dotted line, returning foragers per second; solid line, outgoing foragers per second. Returning foragers were removed for 3 min beginning at the time indicated by the vertical dotted line. Foraging rates before removals were calculated from 100–350 s, including the time it would have taken for removed ants to return to the nest. Foraging rates after removals were calculated from 350–590 s. (A) Example of a trial with no response; foraging did not change in response to the removal of returning foragers. (B) Example of a trial in which the colony responded to the removal of returning foragers by decreasing the rate of outgoing foragers.

