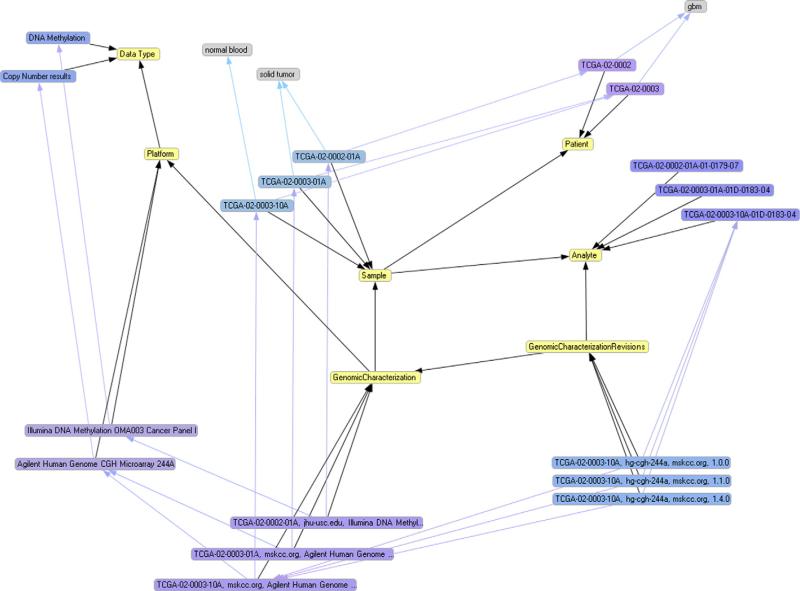
Fig. 8.
A fragment of the RDF graph representation of TCGA created by the software tool Sentient Knowledge Explorer. Yellow nodes represent S3DB Collections, blue and purple nodes represent S3DB Items and grey nodes represent values of properties of the items. Light blue lines represent the relationships between items; black lines represent the connections between the elements of the core. Assignment of TCGA data elements to S3DB core elements results in a directed labeled graph in which the domain (yellow nodes) is clearly separate from its instantiation (blue and grey nodes). The separation of the domain facilitates the assembly of SPARQL queries, as it separates what is an actual data element (for example, sample “TCGA-02-0002-01A”) from what is a domain descriptor (for example, the yellow node “Sample”).

