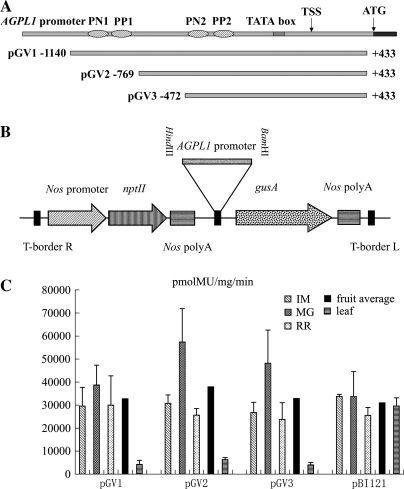
Fig. 3.
(A) Schematic map of the T-DNA region of binary vectors. The rectangular box represents the AGPL1 genome and the horizontal lines below it represent the different 5′ deletions (pGV1, pGV2, and pGV3). The T-DNA regions are not drawn to scale. (B) The T-DNA region of the binary vector, pBI121. The promoter fragments were cloned in the HindIII–BamHI sites. The gusA gene was driven by the AGPL1 promoter deletions (coordinates −1140 to +433, −769 to +433, −472 to +433 from the TSS). The relative positions of the gusA gene and the NPTII gene are shown with respect to the left border (LB) and right border (RB) of the T-DNA. (C) Reporter gene expression in fruit and leaf of stably transformed tomato plants containing the AGPL1 promoter and CaMV 35S promoter, respectively. Fruits and leaves from transgenic tomato plants grown in a growth chamber were pooled and assayed in duplicate. The fruits were growing: immature (IM), mature green (MG), and red ripe (RR). Error bars represent the standard error. Dark bars represent the average for each construct containing the relative promoter.

