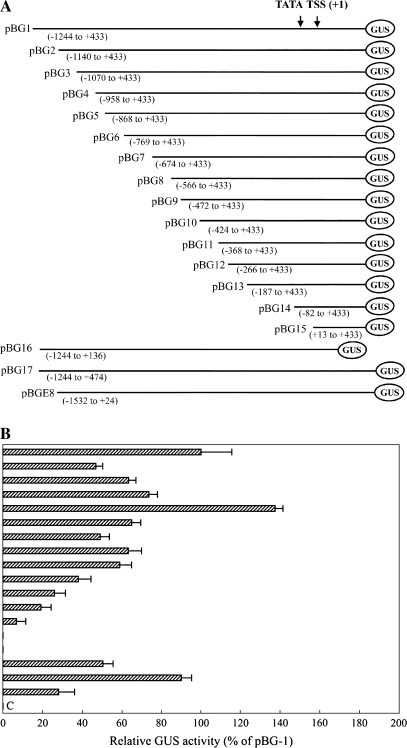
Fig. 4.
(A) A schematic map of the GUS constructs (number 1–18) developed for deletion analysis of the AGPL1 promoter. The 5′ and 3′ end coordinates of the relative deletion fragments are given in parentheses. At the top is shown the relative position of the TATA box, the TSS (+1), and the AGPL1 promoter coordinates. (B) AGPL1 promoter expression analysis in the fruit transient expression assay using the gusA reporter gene. Soluble protein extracts (∼60 mg) from fruit were used for the GUS assay. Each construct was assayed at least three times in independent experiments. The average GUS activity (as a percentage of pBG) with standard division is presented in the histogram. Error bars show the 95% confidence intervals of the means. (C) Untransformed control, extract from fruit.

