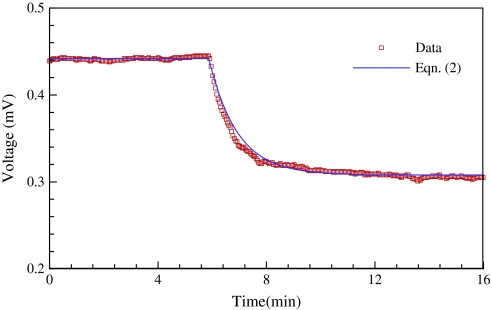
Fig. 2.
Transient response of the sap flow sensor as the flow velocity in the calibration tube suddenly changes from 0 μm s−1 to 190 μm s−1. The symbols are measured data and the line is the prediction of Eqn (2) with time constant Ts=1.1 min. (This figure is available in colour at JXB online.)

