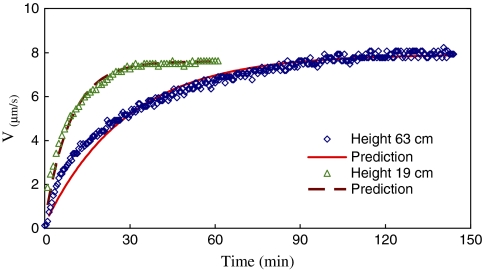
Fig. 5.
Time courses of sap flow velocity of taller stem (height 63 cm) and shorter stem (height 19 cm) plants as the wind speed suddenly increases from 0 m s−1 to 6.0 m s−1. The symbols are measured data and the solid and dashed lines are the predictions of Eqn (5). The time constant for the taller plant is Tc=28.8 min, and for the shorter plant is Tc=9.1 min. (This figure is available in colour at JXB online.)

