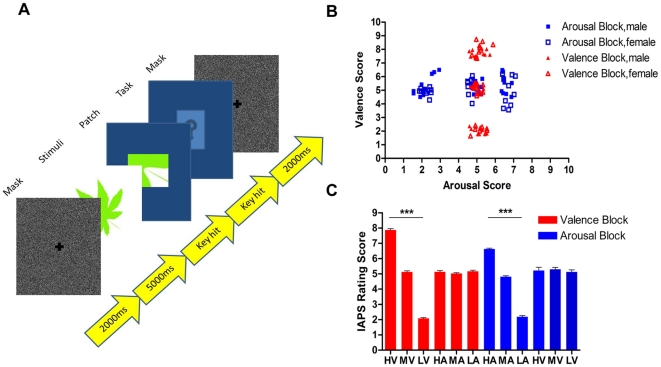
Figure 1. Experiment procedure and stimuli.
(A) Flow chart of the experiment procedure. There were four consecutive stages in each trial: Mask (Gaussian-noise image), Stimuli (display of the target affective picture and monitoring of monocular eye position), Patch (patch image recognition task, to encourage free viewing) and Task (picture familiarity rating on a 7-point scale). (B) The scatterplot shows affective ratings of IAPS pictures in the valence block (VB, red triangles) and the arousal block (AB, blue squares) by females and males. Scores in the two dimensions were independent and decorrelated. (C) The bar graph shows valence ratings among three graded levels (HV, MV, LV) in VB (red bar), and arousal ratings among three graded levels (HA, MA, LA) in AB (blue bar). Three stars mark highly significant difference (p< 0.001, Kruskal-Wallis test).

