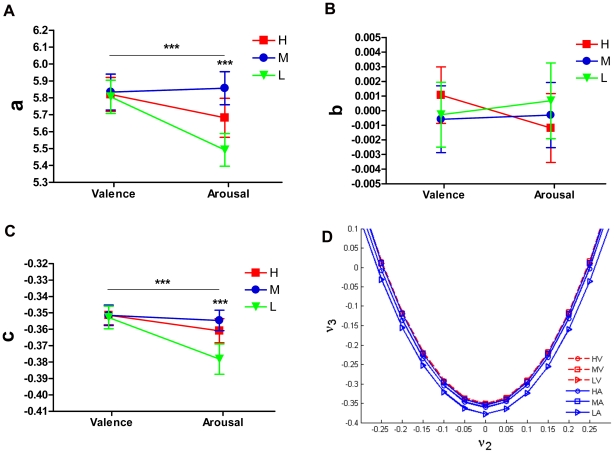
Figure 5. Quadratic curves of  spectral embedding.
The embedded path graph was fitted by the quadratic function in the vertex form of  . (A) Coefficient a is positive, therefore all embedded quadratic curves opened upwards. Fitted quadratic curves in embedded path graph of valenced pictures have larger open width; the coefficient a is significantly different across three arousal levels, indicating a non-linear effect of arousal. (B) Coefficient b represents the symmetry axis of the fitted parabola. There was no significant difference between the valence and arousal blocks for coefficient b. (C) Coefficient c represents the height (vertical position) of the fitted quadratic curves. The fitted curves have larger coefficients c in valenced pictures and were significantly different within graded arousal levels, indicating a non-linear arousal effect. (D) Embedded quadratic curves in each affective level of two blocks. Stars mark significant difference (two stars: p<0.01 and three stars: p<0.001; by ANOVA test). Here
  and
and  denotes the 2nd and 3rd eigenvector of the Laplacian matrix, respectively.

