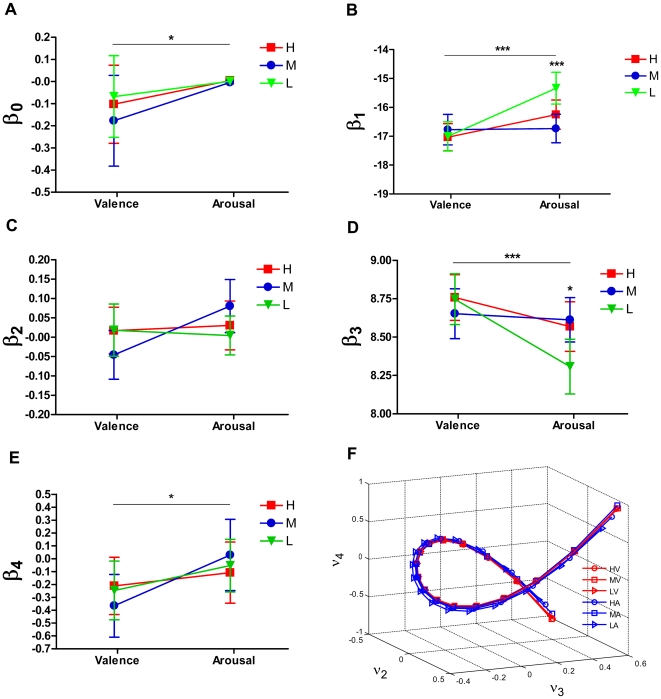
Figure 6. Cubic curves of  spectral embedding.
 The embedded path graph was fitted by the cubic function in the form of
  . (A - E) Coefficients
 ,
, ,
, ,
, and
and  were compared between the two blocks and within each block. There are significant differences between valenced pictures and arousal pictures for the coefficients
  ,
, ,
, and
and  , where coefficients
  and
and  were different in graded arousal levels, indicating a non-linear effect of arousal. (F) The embedded curves in each affective level of valence and arousal. Star marks significant differences (one star: p<0.01; two stars: p<0.01 and three stars: p<0.001; by ANOVA test). Here
  ,
,  and
and  denote the 2nd, 3rd and 4th eigenvector, respectively.

