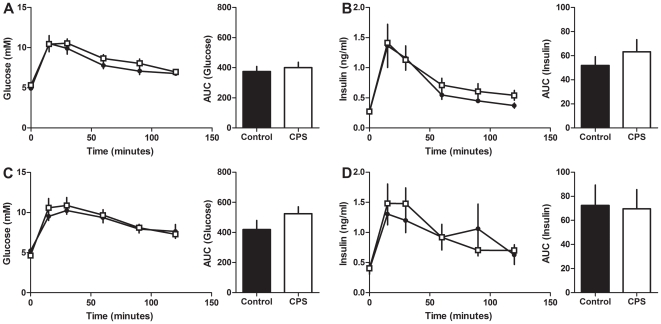
Figure 6. Glucose tolerance in 3 month old CPS and control offspring.
Blood glucose and plasma insulin concentrations of CPS and control 3 month old female and male offspring following a 1 g/kg intraperitoneal injection of glucose. A: female blood glucose, B: female insulin, C: male blood glucose, D: male insulin. CPS (□) control (•). The data are the mean ± SEM (n = 7/treatment/gender). Area under the glucose and insulin curves were calculated relative to the baseline value for each rat.

