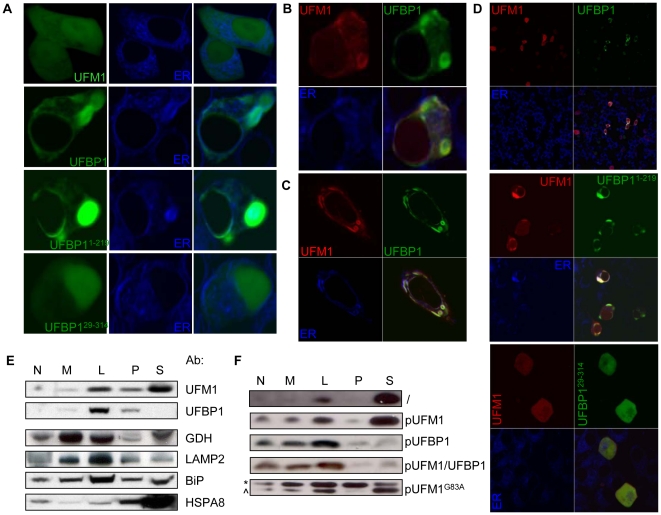
Figure 4. UFBP1 and UFM1 are co-localized in the ER.
A INS1-832/13 cells transfected with different eGFP constructs as indicated on the picture. INS1-832/13 cells (B) and Hela cell (C) co-transfected with mRFP-UFM1 and UFBP1-eGFP, D Overview of INS1-832/13 cells co-transfected with mRFP-UFM1 and UFBP1-eGFP, UFBP129–314-eGFP or UFBP11–214-eGFP, as depicted. Cells were also stained with an ER-tracker (blue). Pictures were taken with a 63× objective on a Zeiss confocal microscope, E UFM1 and UFBP1 expression in different MIN6 cellular fractions, similar as in Figure 2E. Different cellular markers were used: GDH, mitochondrial marker; LAMP2, lysosomal marker; BiP, ER marker and HSPA8, cytosolic marker. F UFM1 expression after cellular fractionation of MIN6 cells overexpressing UFM1, UFBP1, both UFM1 and UFBP1 or UFM1G83A, as depicted (*, unprocessed; ∧, processed).

