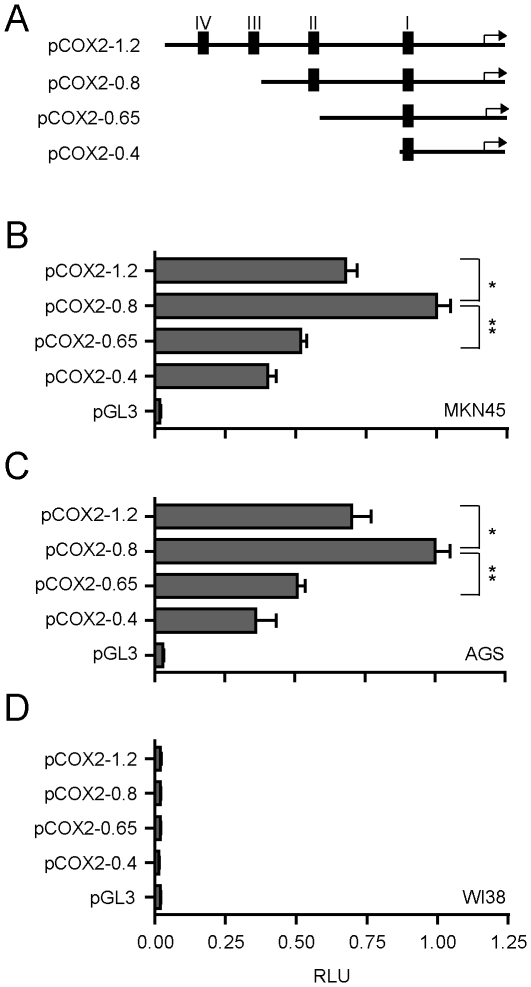
Figure 4. pCOX2-0.8 as a minimal COX2 promoter with maximum basal response in GC cells.
(A) Schematic representation of pCOX2 deletions. (B–D) Gene reporter assay in MKN45 (B), AGS (C) and WI38 (D) cell lines transiently transfected with 50 ng pCOX deletions (pCOX2-1.2; pCOX2-0.8; pCOX2-0.65 and pCOX2-0.4) and 50 ng of empty vector. In all experiments cells were transfected with 1 ng of PRL-SV40 Renilla as an internal control. Promoter activity was normalized as the ratio between firefly luciferase and Renilla luciferase units. RLU: Relative Luciferase Units. Each figure corresponds to at least three independent experiments. Statistical significance was determined through ANOVA test (* p<0.05, ** p<0.01).

