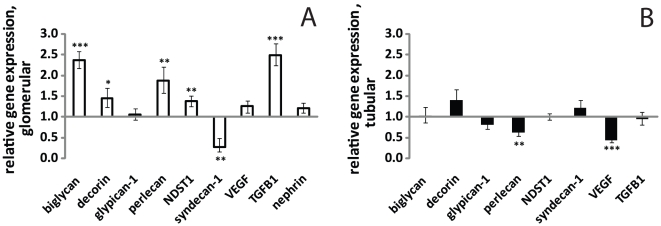
Figure 1. Relative gene expression of proteoglycan core proteins and enzymes in glomeruli (A) and tubulo-interstitial compartment (B) of biopsies from IgAN patients compared to controls.
Controls values are defined as 1, and higher values indicate up-regulation while lower values indicate down-regulation. Error bars represent SEM. *p<0.05, **p<0.01, ***p<0.001.

