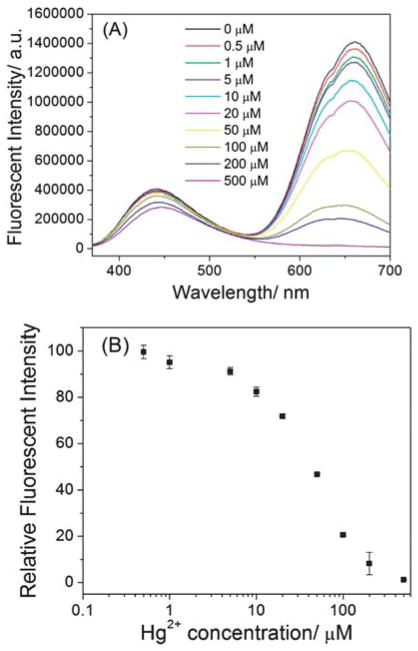
Fig. 5.
(A) The fluorescent spectra of as-prepared LsGFC probes (~ 34 μM) in the absence and presence of different concentrations of Hg2+, (B) the relative fluorescent intensity at 660 nm vs. Hg2+ concentration. The excitation wavelength was 360 nm. The error bars represent the standard deviation of three measurements.

