Figure 1.
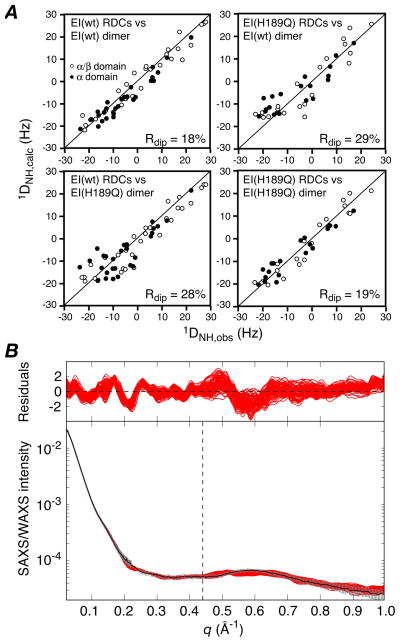
(A) Comparison of observed and calculated RDCs for the E. coli EI (wild-type) and EI(H189Q) dimers The experimental RDCs for the EI(H189Q) mutant comprise 20 backbone 1DNH couplings for each subdomain of EIN (i.e. a total of 40×2 RDCs for the dimer) obtained from a 1H-15N TROSY-based ARTSY spectrum15 with EI(H189Q) aligned in a dilute liquid crystalline medium of pf1 phage16 (11 mg/ml). For wild-type EI there are 29 1DNH couplings for each subdomain of EIN (i.e. a total of 58×2 RDCs for the dimer).9 Top right, wild-type RDCs versus wild-type dimer structure;9 top left, EI(H189Q) RDCs versus wild-type EI dimer structure; bottom left, wild-type RDCs versus EI(H189Q) dimer structure (this paper); bottom right, EI(H189Q) RDCs versus EI(H189Q) dimer structure. (B) Comparison of experimental SAXS/WAXS curves (black with gray vertical bars equal to 1 s.d.) recorded for EI(H189Q) with the calculated curves for the final 100 simulated annealing structures in red. The residuals given by are plotted above. The structures were determined by refining against the SAXS/WAXS curve in the range q ≤0.44 Å−1, and the upper end of this range is indicated by the vertical dashed black line. The SAXS/WAXS data were collected at the Advanced Photon Source (Argonne National Laboratory) and processed as described previously.9 The SAXS data extend out to q = 0.22 Å−1 and report on interatomic interactions > 28 Å. The SAXS/WAXS data used in refinement (q ≤ 0.44 Å−1) report on interatomic interactions down to 14 Å, and therefore include additional information related to interdomain interactions.

