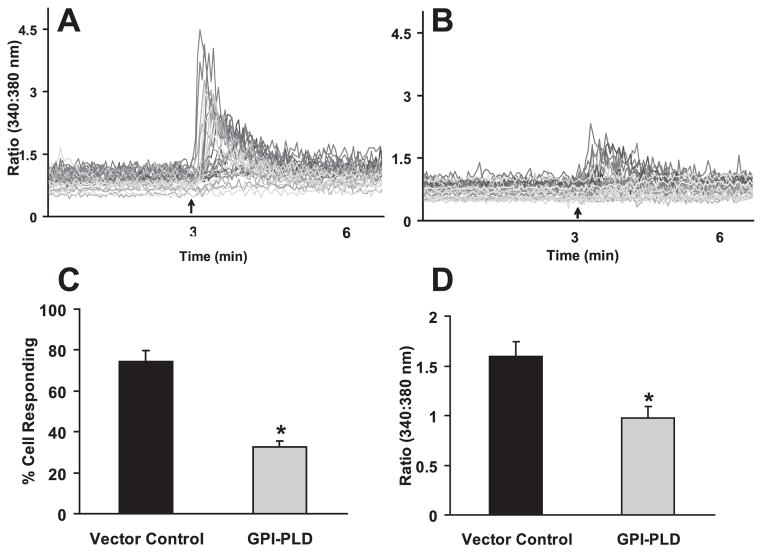
Figure 4. Overexpressing GPI-PLD inhibits oscillatory fluid flow induced increases in [Ca2+]i in MC3T3-E1 osteoblastic cells.
A, a representative example of MC3T3-E1 cell [Ca2+]i traces obtained after exposure of control cells (expressing pcDNA3 vector control) to oscillatory flow (2N/m2, 1Hz). The arrow depicts the onset of flow and each line represents an individual cell response. B, a representative example of MC3T3-E1 cell [Ca2+]i traces obtained after exposure of pcDNA3-GPI-PLD expressing cells to oscillatory flow (2N/m2, 1Hz). The arrow depicts the onset of flow and each line represents an individual cell response. C, the percentage of MC3T3-E1 cells responding with an increase in [Ca2+ ]i in cells expressing the pcDNA3 vector control or pcDNA3-GPI-PLD (GPI-PLD). D, the mean amplitude of [Ca2+ ]i in MC3T3-E1 cells, expressing the pcDNA3 vector control or pcDNA3-GPI-PLD (GPI-PLD), responding with an increase in [Ca2+]i. (*, p<0.05) Each bar represents the mean ± S.E. and each experiment was repeated on 4–6 slides.

