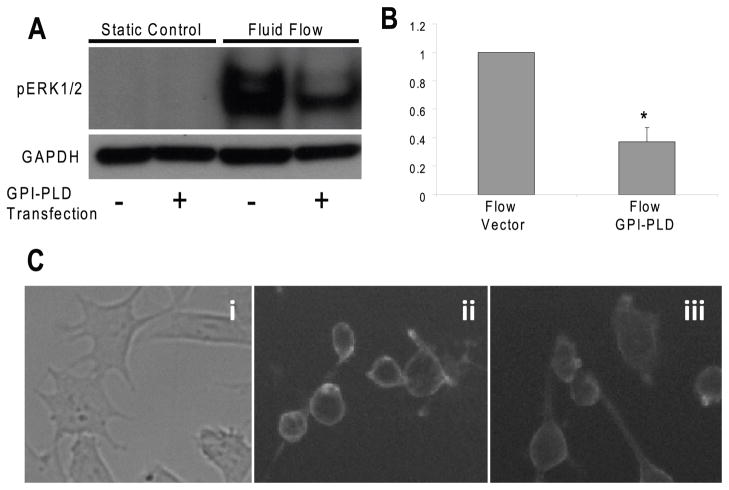
Figure 5. Overexpression of GPI-PLD inhibits oscillatory fluid flow induced ERK1/2 phosphorylation in MC3T3-E1 osteoblastic cells.
A, oscillatory fluid flow induced ERK1/2 phosphorylation at 5 minutes significantly decreased in GPI-PLD expressing cells (lane 2 and 4) compared with that in control cells (expressing pcDNA3 vector control, lane 1 and 3). B, bar graph representation of ERK1/2 phosphorylation quantified by scanning densitometry normalized to GAPDH. C, bright field image (i) and fluorescence images taken at the same exposure time in cells expressing pcDNA3 control vector (ii) and overexpressing GPI-PLD (iii) in MC3T3-E1 cells. (*, p<0.05) Each bar represents the mean ± S.E. and each experiment was repeated 3–5 times.

