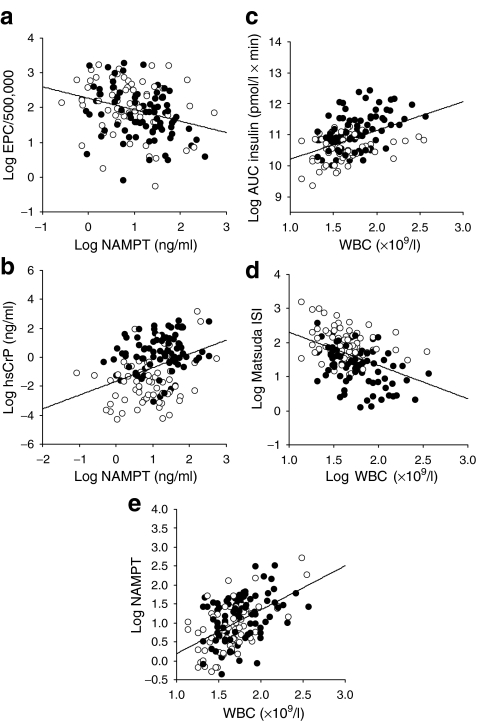
Fig. 3.
NAMPT association with leucocytes in the Leipzig Atherobesity Childhood cohort. Correlation of NAMPT serum levels with EPC count (a) (r = −0.29, p < 0.001) and hsCrP (b) (r = 0.34, p < 0.001). Correlations of WBC count with metabolic variables AUC insulin (c) (r = 0.35, p < 0.001) and Matsuda ISI (d) (r = −0.33, p < 0.001). The strongest correlation was achieved between NAMPT and WBC count (e) (r = 0.46, p < 0.001). White circles, lean children; black circles, obese children. Correlation coefficients were determined by Pearson correlation analyses of log-transformed variables

