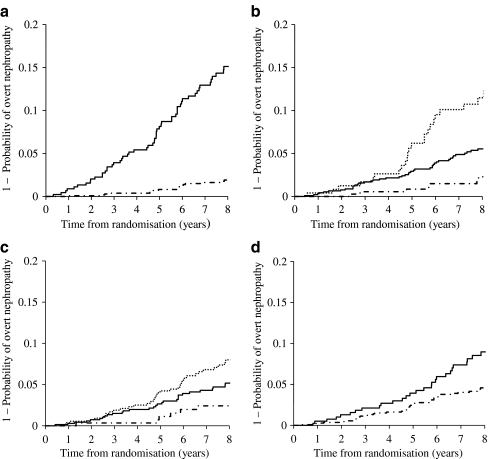
Fig. 1.
Kaplan–Meier curves for progression to overt nephropathy according to: UACR (a), HbA1c levels (b), SBP (c) and smoking status (d). a The hazard ratio for the low-microalbuminuric group (solid line) was 8.45 (95% CI 4.97–14.38, p < 0.01) relative to the normoalbuminuric group (dashed–dotted line). b The hazard ratio of HbA1c for a range of 7–9% (solid line) and for ≥9% (dotted line) was 2.72 (95% CI 1.22–6.03, p < 0.01) and 5.81 (95% CI 2.49–13.55, p < 0.01), respectively, relative to an HbA1c of <7% (dashed–dotted line). c The hazard ratio for an SBP of 120–140 mmHg (solid line) or ≥140 mmHg (dotted line) was 2.31 (95% CI 0.96–5.54, p < 0.06) and 3.54 (95% CI 1.50–8.40, p < 0.01), respectively, relative to an SBP of <120 mmHg (dashed–dotted line). d The hazard ratio for current smoking (solid line) was 1.99 (95% CI 1.24–3.18, p < 0.01) relative to past smoking or never smoked (dashed–dotted line)

