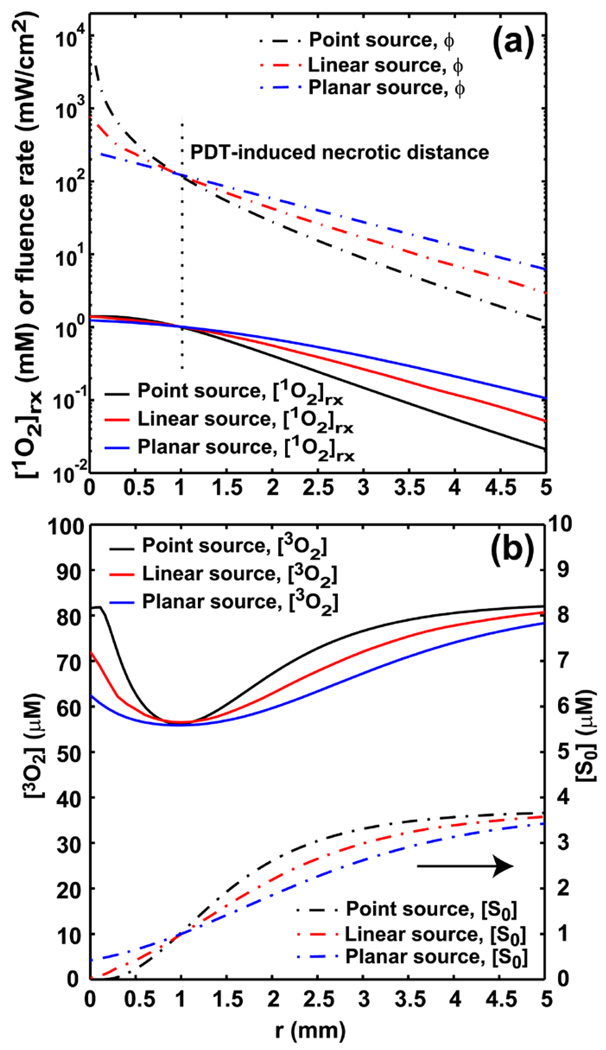
Figure 6.
(a) The spatial distributions of [1O2]rx and fluence rate for point, linear, and planar source. For point and linear source, r is the radial distance relative to the source. For planar source, r is the depth relative to tissue surface. The light fluence rate at r = 0.96 mm is fixed for the 3 sources setting, and the delivered fluence at 0.96 mm is 332 J/cm2. The vertical dash line shown in Fig. 6a indicates the location of r = 0.96 mm, PDT-induced necrotic distance, away from source locations. Fig. 6b shows the corresponding [3O2] and [S0] distributions for the 3 source setting.

