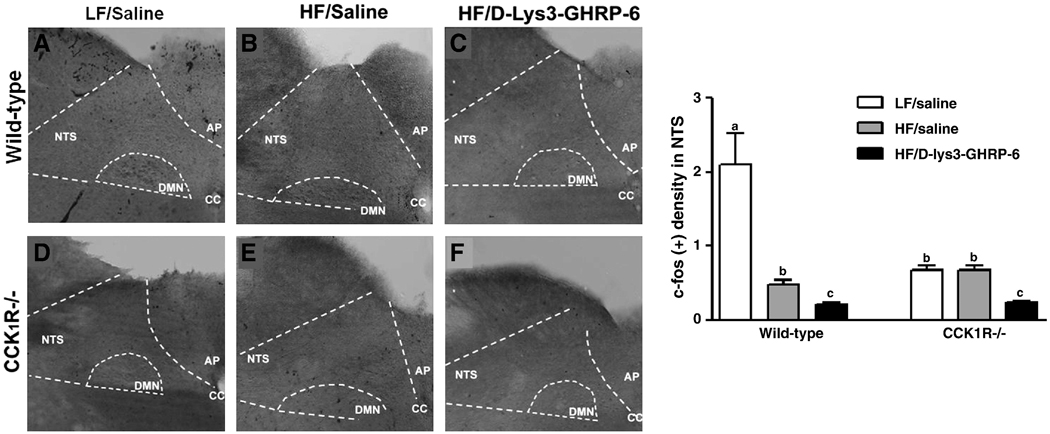
Figure 3. Effect of ghrelin and D-(Lys3)-GHRP-6 on c-fos-IR in hindbrain neurons.
Representative photomicrographs of the NTS of wild-type and CCK1R−/− mice (n=4–6) treated with saline or D-(Lys3)-GHRP-6 (2.8µg/kg). c-fos-immunoreactivity was quantified as labeling density, where the number of c-fos neurons in the NTS region was counted and normalized to total background area. a,b indicate p<0.05 by two-way ANOVA followed by Bonferroni’s post-hoc test. Values represent mean ± SEM.

