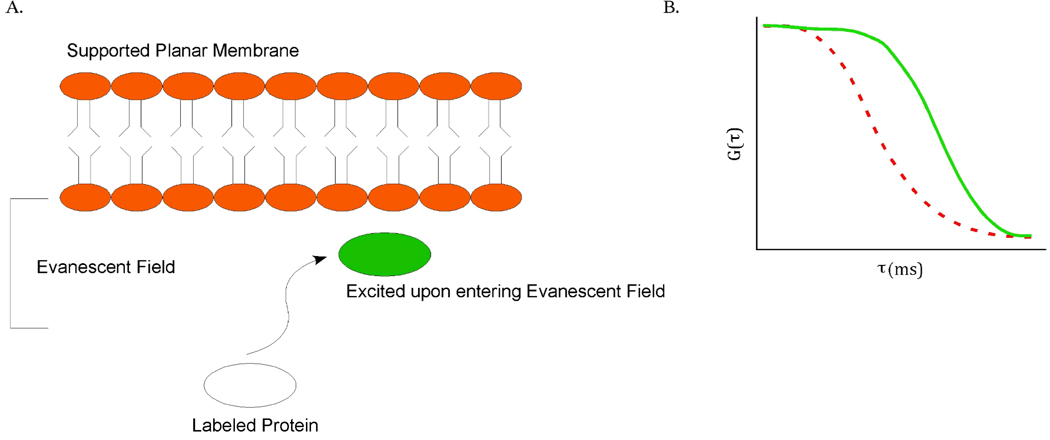
Figure 7.
Schematic of soluble ligand binding on a planar membrane (a). Ka and Kd (association and dissociation rate constants) were later determined for IgG interacting with the planar membrane. The correlation curve on right (b) shows the TIR-FCS data of the diffusion of labeled IgG with unlabeled IgG close to the planar membrane (dotted red FCS curve shows small molecule diffusion in solution for comparison). Adapted from Reference 68.

