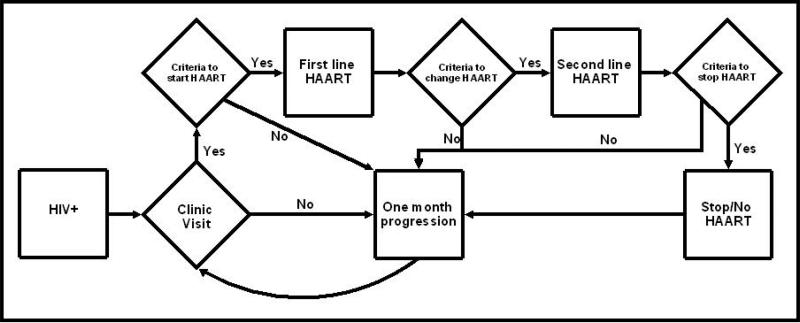
Figure 1. Model flow of routine patient care management.
Squares represent states or processes, and diamonds represent decision nodes. For example, newly diagnosed HIV+ patients are seen in clinic, and evaluated whether they meet criteria to start ART. If they meet criteria, they are started on first-line ART, and if they do not meet criteria, the model evaluates them again next month. The model does not show the development of acute clinical events such as severe opportunistic diseases or some medication toxicities, which may occur at any time.

