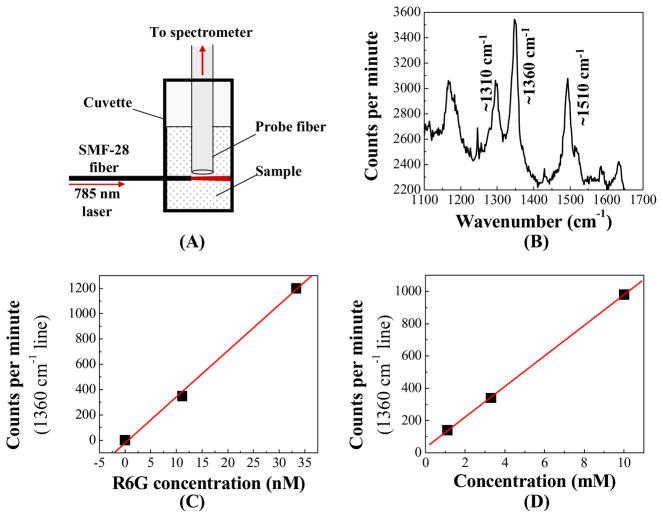
Fig. 4.
(A) Experimental setup to characterize the SERS enhancement of the Ag colloid. (B) Measured Raman spectrum for 33 nM R6G in Ag colloid using the setup in (A). (C) Raman intensity versus R6G concentration in Ag colloid using the setup in (A). Each data point is the peak value of the characteristic R6G 1360 cm−1 Raman line for at least two averaged spectra. (D) Raman intensity versus R6G concentration in water. Again, each point is the peak value of the 1360 cm−1 line.

