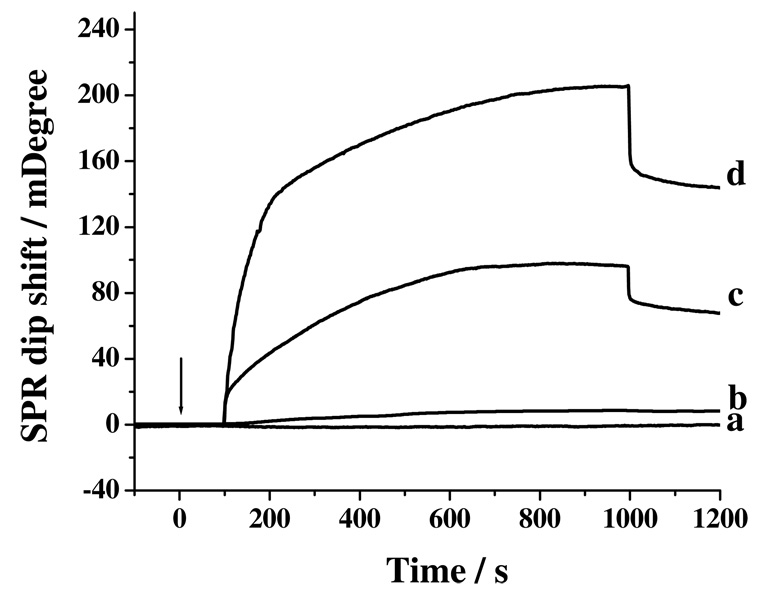
Figure 2.
SPR sensorgrams after injections of (a) 1.00 and (b) 50.00 nM of Aβ(1–40) into precoated channel with Aβ(1–40) capture antibody, (c) curve (a) + 30.00 nM of Aβ(1–16) mAb, and (d) curve (a) + 30.00 nM of the detection conjugate. The arrow indicates the time when the injections were made and the flow rate was 10 μL/min. The delays in all the sensorgrams between the times when injections were made and signals were observed are times needed for the injected sample plugs to travel from the injection valve to the SPR flow cell.

