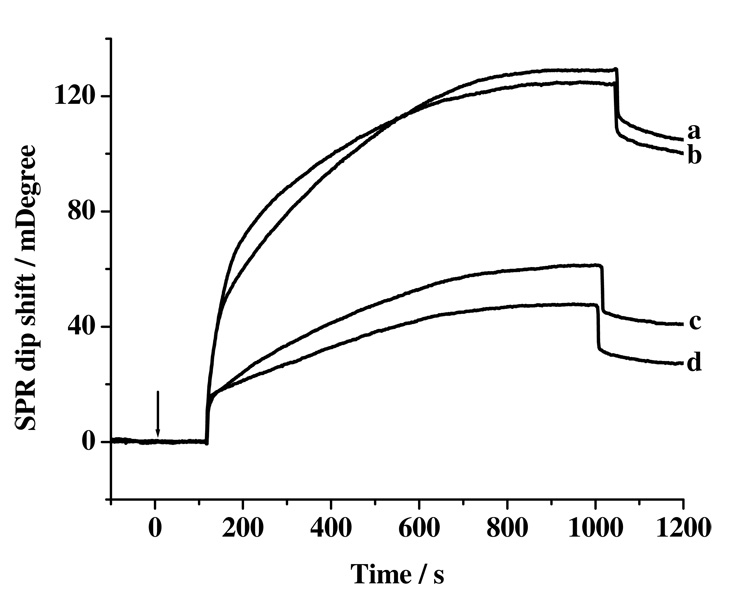
Figure 5.
SPR sensorgrams depicting simultaneous detection of Aβ(1–40) and Aβ(1–42) concentrations in CSF collected from healthy donors (curves a and c for Aβ(1–40) and Aβ(1–42), respectively) and AD patients (curves b and d for Aβ(1–40) and Aβ(1–42), respectively) with signal amplification by the detection conjugate. The arrow indicates the time when the injections of the detection conjugate were made.

