
Figure 1.
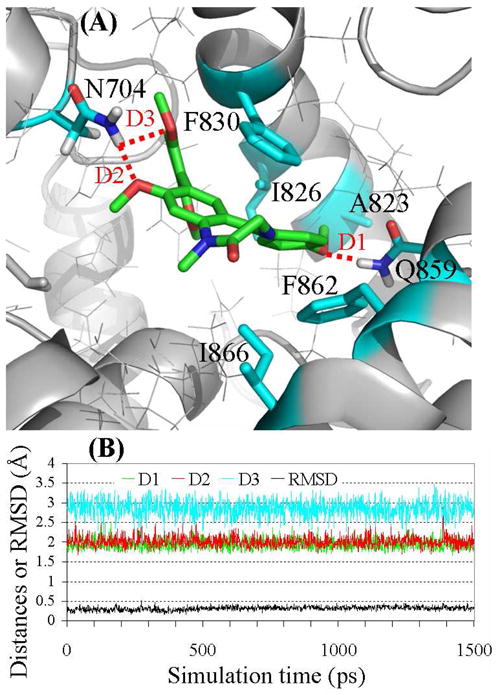
(A) Ribbon diagram for the binding mode of the MD-simulated structure of compound 1 in the active site pocket of PDE2A. The intermolecular hydrogen bonds are highlighted in dashed red line. (B) Plots of the MD-simulated internuclear distances and RMSD for atomic positions of the ligand versus the simulation time for PDE2A binding with compound 1. Trace D1 represents the internuclear distance between the oxygen of the methoxy group (R4) and a hydrogen atom of the amine group in Gln859 side chain. Trace D2 represents the internuclear distance between the oxygen of the methoxy group (R2) and a hydrogen atom of the amine group in Asn704 side chain. Trace D3 refers to the simulated partial hydrogen bond between the oxygen of a methoxy group in R3 and a hydrogen atom of the amine group in Asn704 side chain, with the H···O distance ranging from 1.96 to 3.47 Å (average: ~2.85 Å).