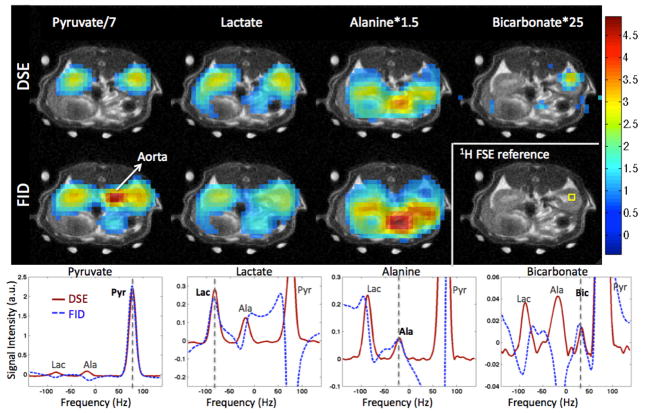
Figure 2.
Metabolic images of Pyr, Lac, Ala, and Bic along with spectra from a voxel in the rat right kidney (voxel location is shown in 1H anatomical image). DSE-spCSI magnitude mode spectra yield similar linewidth as FID-spCSI absorption mode spectra, eliminating the need for phase correction. Bic image is not shown for FID as it was contaminated by out-of-phase Pyr signal. The DSE sequence also suppresses signal from flowing spins in blood vessels, which is clearly seen in the Pyr map. The spectra for Pyr, Lac, Ala and Bic are plotted separately due to the independent reconstructions performed for each of them. The vertical dashed lines indicate the frequency of the main (in-focus) spectral component in each of the reconstructed spectra.

