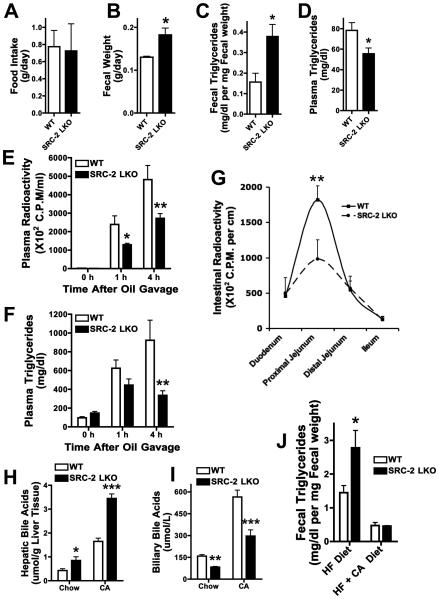
Fig. 2. Hepatic SRC-2 modulates dietary fat absorption in a BA dependant manner.
A-D) Food intake, fecal output, fecal triglycerides and plasma triglycerides were measured in WT and SRC-2 LKO mice (liver specific ablation) fed standard chow ad libitum for 24 hours following an overnight fast (n=5 mice per group).
E-F) Plasma radioactivity and triglyceride levels were measured in chow-fed WT and SRC-2 LKO mice after injection of the lipase inhibitor tyloxapol and gavage with olive oil containing 14C-trioleoylglycerol (n=5 mice per group).
Data are represented as mean + SEM. Two-way ANOVA with Bonferroni posttests to compare replicate means by row was used for evaluation of statistical significance. One asterisk indicates p < 0.05, two asterisks p < 0.01 and three asterisks p < 0.001.
G) Intestinal radioactivity levels were measured in WT and SRC-2 LKO mice 2 hours after gavage with olive oil containing 14C-trioleoylglycerol (n=5 mice per group).
Data are represented as mean + SEM. Two-way ANOVA with Bonferroni posttests to compare replicate means by row was used for evaluation of statistical significance. One asterisk indicates p < 0.05, two asterisks p < 0.01 and three asterisks p < 0.001.
H-I) Hepatic and biliary BA levels were measured in WT and SRC-2 LKO mice on standard-chow and on 1% cholic-acid diet for two weeks. Bile was obtained from the gall bladder and is representative of intestinal BA levels (n=4-5 mice per group).
J) Fecal triglyceride levels were measured in chow-fed WT and SRC-2 LKO mice upon exposure of mice to a high fat diet (60% calories from fat) and a diet containing high fat plus 1% cholic-acid for 48 hours (n=4-5 mice per group).
Data are represented as mean + SEM. Unless otherwise indicated, unpaired student's t-test was used for evaluation of statistical significance. One asterisk indicates p < 0.05, two asterisks p < 0.01 and three asterisks p < 0.001.
See also Fig. S1 and Fig. S2

