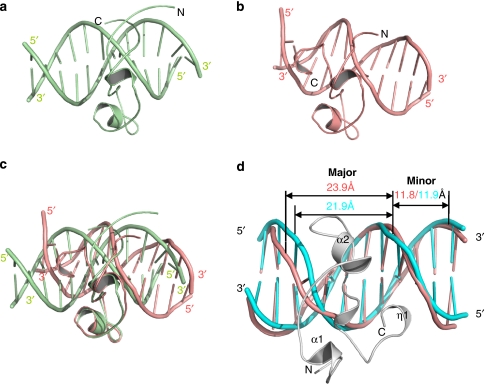
Figure 3. Comparison of CFP1–CpG complex (CCGG1) with MLL1–CpG complex (PDB id: 2KKF).
(a) Overall structure of MLL1-CpG DNA shown in green cartoon representation. (b) Overall structure of CFP1-CpG DNA shown in salmon cartoon representation. (c) Superposition of the CFP1 CXXC domain (salmon) and the MLL1 CXXC domain (green) of the MLL–DNA and CFP1–DNA complexes. (d) Superimposition of the CpG DNA from the CFP1–DNA complex (salmon) and the standard 12-mer B-form DNA (cyan; PDB id: 1HQ7). The protein is shown in grey cartoon representation. The widths of major grooves and minor grooves of both DNAs are marked in red (CFP1 DNA) and cyan (B-DNA), respectively.

