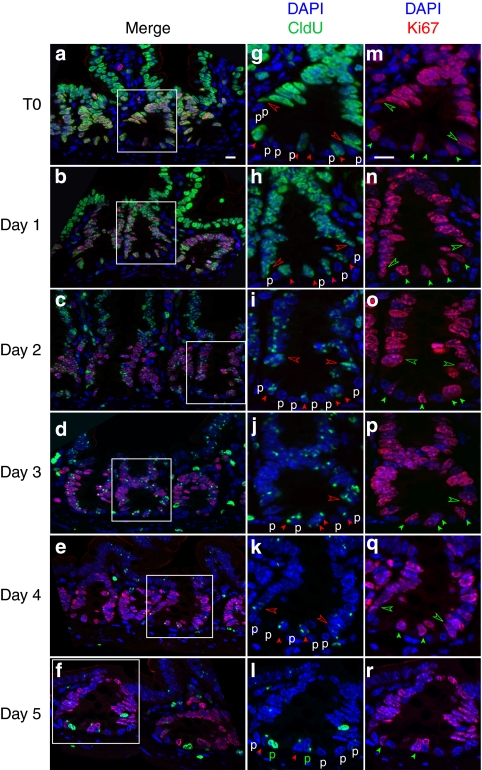
Figure 4. CldU and Ki67 immunostaining of the CBC and cp4 cell populations.
Mice were killed at the beginning of the chase period (T0) and every day for 5 consecutive days. (a–f) Merged lower power views of ileal crypt sections stained for CldU (green) and Ki67 (red), and counterstained with 4′-6-diamidino-2-phenylindole (DAPI) on (a) day 0, (b) day 1, (c) day 2, (d) day 3, (e) day 4 and (f) day 5. (g–r) Enlarged single-channel views of the crypt sections present in the insets. (g–l) CldU staining on (g) day 0, (h) day 1, (i) day 2, (j) day 3, (k) day 4 and (l) day 5. Note that the number but not the intensity of the spots steadily decreased from T0 (g) to day 5 (l), attesting the progressive loss of labelled chromosomes through successive divisions. (m–r) Ki67 staining on (m) day 0, (n) day 1, (o) day 2, (p) day 3, (q) day 4 and (r) day 5. Closed and open arrowheads point to CBC cell and cp4 cell nuclei, respectively. P, unlabelled (white) and CldU-labelled (green) Paneth cell nuclei. Scale bars, 10 μm.

