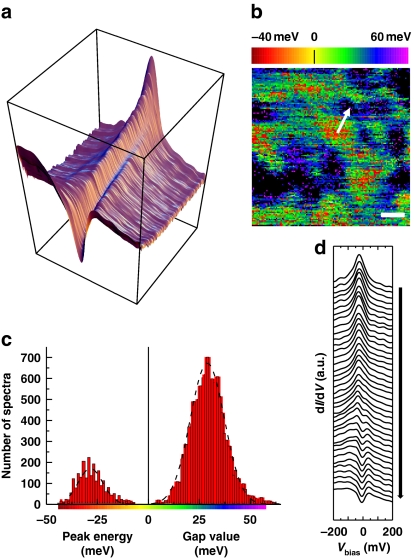
Figure 1. Low-temperature (5 K) STS spectroscopy of as-grown Bi-2201 (AG11 K).
(a) Three-dimensional overview of the data: each curve is the average of 60 spectra sharing the same Ep value (Ep is the peak position for single-peak spectra, and half the peak-to-peak distance for two-peak spectra); the curves are sorted by increasing Ep. Note the smooth transition between completely different curves at extremal values of Ep. (b) Ep map of a 14×14 nm2 area. The white bar corresponds to 2 nm. The red and yellow regions correspond to negative Ep (single-peak spectra) while in green, blue and purple regions, the spectra exhibit a gap width of Δp=Ep. Red-yellow spots are surrounded by green regions where the smallest gap is measured (∼20 meV). Black patches are composed of spectra (∼4,000 in total) in which no gap could be extracted due to a missing left peak (or sometimes no peak at all); these spectra are not included in the histogram of panel c. (c) Distribution of Ep values. The dashed lines are Gaussian fits. The average peak position and average gap values are −28 and +29 meV, respectively. (d) Spatial evolution of the spectra on the path depicted by the arrow in b. The path goes from a red region (top-most single-peak spectrum) to a black region where the left coherence peak is barely visible. Notice the strong similarity with the global evolution shown in a.

