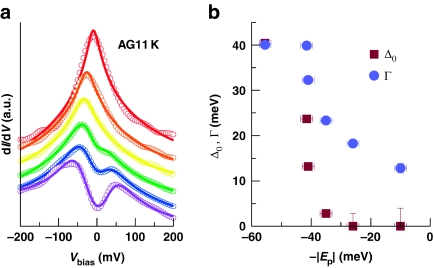
Figure 4. Theoretical interpretation of Bi-2201 tunnelling spectra.
(a) Comparison of representative dI/dV curves in the as-grown sample (circles) with fits based on a simple model (lines). The model involves a 2D tight-binding dispersion with a VHS, a d-wave BCS gap and a constant scattering rate. The curves are offset vertically for clarity. (b) Squares indicate amplitude of the BCS gap determined by the fits, as a function of −|Ep|. When Δ0=0 (single-peak spectra), the model corresponds to independent electrons that are subject to a constant scattering rate, and the peak is the VHS. Circles indicate trend of the phenomenological scattering rate Γ as a function of −|Ep|.

