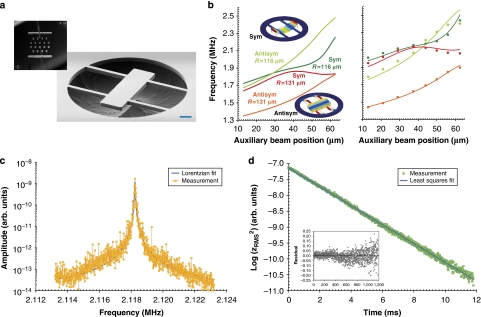
Figure 2. Characterization of the completed free–free resonators.
(a) Optical micrograph of the 5×5 mm chip containing the batch-fabricated microresonators as well as an electron micrograph highlighting a single suspended structure; the scale bar in this image is 20 μm. (b) Simulated (left) and measured (right) eigenfrequencies as a function of the auxiliary beam y-coordinate. The measured values (discrete points) show excellent agreement with the simulated data set, albeit with a slight offset dependent on the parity of the mode. The fitting lines in the right plot correspond to a mean frequency offset of 262 kHz for the symmetric (sym) free–free modes and 89 kHz for the neighbouring antisymmetric (antisym) modes (inset images show the FEM-derived mode shapes). Lower panels—examples of the fitting techniques utilized for Q-value extraction including: (c) Lorentzian fitting of the free–free resonance (captured on a spectrum analyser) for a device with R=116 μm and ya=29 μm resulting in Q=4.5×10⁴ and (d) ringdown fitting of the same device using linear regression of the natural log of the mean square of the free-ringdown signal captured single-shot with a high-speed oscilloscope yielding Q=4.46×10⁴. The inset includes the residuals to the linear fit showing an excellent agreement with the expected exponential decay.

