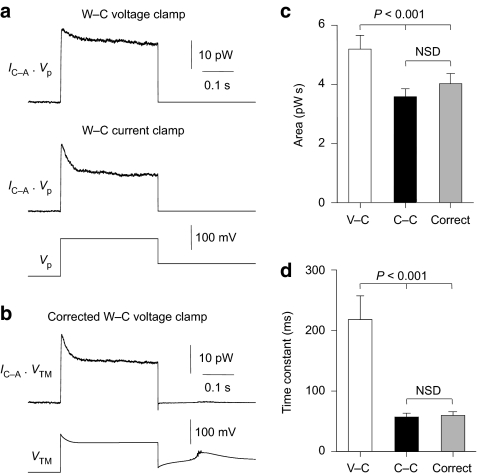
Figure 4. Transmembrane voltage responses control the time course of ensemble potassium channel activity in cell-attached patches.
(a) The time course of waveforms calculated by multiplying cell-attached leak-subtracted potassium currents by the pipette command voltage (VP) during simultaneous whole-cell (W-C) voltage-clamp (v-c) and current-clamp (c-c) recording from the soma of a thalamocortical neuron. (b) For the same patch, a transmembrane potential corrected waveform was calculated by multiplying the cell-attached current recorded under whole-cell v-c by the estimated transmembrane voltage change that occurred under whole-cell c-c (VTM). Transmembrane voltage was calculated by the addition of the pipette command voltage and the intracellular voltage deviation recorded under whole-cell c-c. Note the similarity of this waveform to that directly recorded under whole-cell c-c conditions (a). (c, d) The area (c) and decay time constant (d) of transmembrane corrected (correct) waveforms are not significantly different (NSD) from those directly recorded under whole-cell c-c conditions. The area and decay time constant of waveforms recorded under whole-cell voltage- and current-clamp conditions are, however, significantly different. Pooled data (n=32) are presented as mean±s.e.m. and statistical significance determined with analysis of variance.

