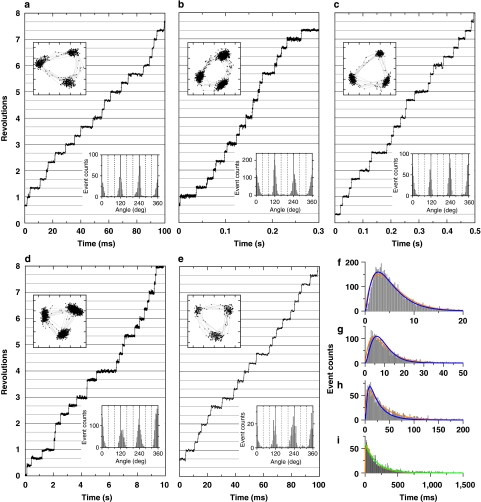
Figure 2. Rotation of V1.
(a–e) Typical time courses of rotation with a 40-nm bead (or duplex). (a) Rotation at 4 mM ATP captured at 8,000 fps; (b) 200 μM ATP at 2,000 fps; (c) 40 μM ATP at 250 fps; (d) 4 μM ATP at 4,000 fps and (e) 2 mM ATP at 4,000 fps, obtained from the same molecule as in d after medium exchange. Trajectories of the bead centroid (axis divisions: 11.1 nm) and histograms of angular positions, both for the indicated portion of the records, are shown in the upper and lower insets, respectively. (f–i) Histograms of dwell times between 120° steps. (f) Dwell times at 4 mM ATP with 125 μs bin size obtained from 6 molecules observed at 8,000 fps; (g) 200 μM ATP, 250 μs bin size, 6 molecules at 8,000 fps; (h) 40 μM ATP, 1 ms bin size, 6 molecules at 4,000 fps; (i) 4 μM ATP, 4 ms bin, 15 molecules at 2,000 fps. Orange curves show fit with the sequential two-reaction scheme with rates ka and kb: constant·(exp(−kat) − exp(−kbt)). At 4 mM ATP, the two rates turned out to be indistinguishable and thus the fit was made with two identical rates k: constant·t·exp(−kt). The estimated rates and associated s.e. are: k4 mM=0.36±0.01 ms−1, ka200 μM=0.17±0.02 ms−1, kb200 μM=0.28±0.03 ms−1, ka40 μM=31±1 s−1, kb40 μM=0.40±0.03 ms−1, and ka4 μM=6.1±0.1 s−1, kb4 μM=0.26±0.02 ms−1. If we assume that ka represents the rate of ATP binding (ka=kon[ATP]), kon is given as 0.85×10⁶ M−1 s−1 at 200 μM ATP, 0.78×10⁶ M−1 s−1 at 40 μM and 1.5×10⁶ M−1 s−1 at 4 μM. At 4 μM, kon should dominate the histogram, and the green fit with constant·exp(−kon[ATP]t) gave kon of 1.5×10⁶ M−1 s−1. Blue curves show a global fit to f–h (equal weight for each count), with sequential reactions starting with ATP binding at the rate kon[ATP] and two ATP-independent reactions with rates k1 and k2: constant·{(k2−k1)·exp(−kon[ATP]t) + (kon[ATP]−k2)·exp(−k1t) + (k1−kon[ATP])·exp(−k2t)} with kon=(1.2±0.1)×106 M−1 s−1, k1=0.49±0.05 ms−1, k2=0.34±0.04 ms−1.

