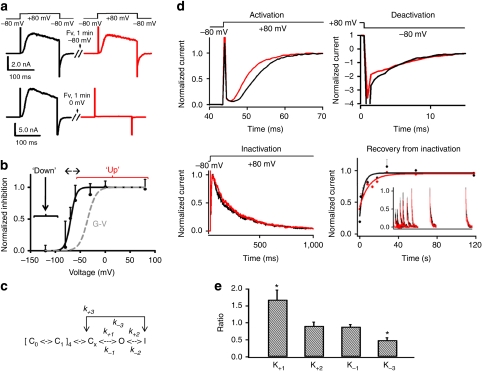
Figure 1. An up-conformation-specific binder for KvAP VSDs.
(a) Voltage-dependence of Fv-Binding. Fv (1.0 μg ml−1) was perfused to the cis side of a stable bilayer held at a test potential for 1 min. After the treatment, the membrane was returned to −80 mV for 2 min before next test pulse. Current traces before (black) and after (red) Fv treatment at −80 mV and 0 mV are presented. (b) Normalized inhibition plotted against testing potentials (black dots, mean±s.d., n=4). Boltzmann fitting (black line) yielded V1/2=−70.3±1.1 mV, Zδ =5.0±0.97. The grey dashed line is a typical G–V curve of KvAP with V1/2=−35 mV, Zδ=3.5. (c) A gating scheme. C1, Cx, O, I are Fv-accessible. At depolarization, k−2, k+3 are negligibly small. (d) Top two panels show typical traces of activation (+80 mV) and deactivation (–80 mV) before (black) and after (red) Fv treatment. Bottom left is the inactivation at +80 mV without (black) and with (red) Fv. Bottom right shows the recovery from inactivation at −80 mV before (black) and after (red) Fv treatment by using a paired-pulse protocol. Inset showed two trains of normalized traces (red +Fv, black control) elicited by the second of the paired pulses plotted against specific intervals between paired pulses. (e) Fv-induced changes in kinetic rates (P<0.036 for K+1, P<0.016 for K−3; error bars represent s.d., n=4). Ki=ki,Fv/ki,no Fv, i=±1,+2,–3 (Supplementary Note S2, K+1=1.68+0.29, K+2=0.91+0.11, K−1=0.89+0.07 and K−3 =0.49+0.074, mean±s.d., n=4). When measured k−3 and k−1 are used at depolarization voltages, [FvI]/[FvC] ~3.5-folds of [I]/[C].

