
Fig. 3.
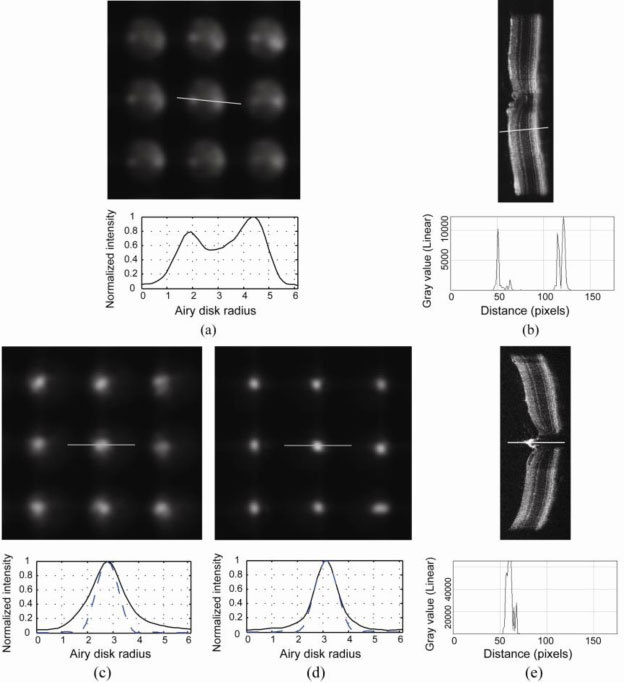
(a) Typical non-optimized wavefront sensor spot pattern in the mouse eye with a cross section of a single spot shown below. (b) An OCT line scan image with a cross section on a particular retinal location. OCT signal vs. depth for the cross section is shown below in linear scale. Both the wavefront spots and the OCT image show back reflections from two major layers from the retina. (c) Improved wavefront spots when the beacon is focused on the outer retina, when source focus was set at ~-10 D. Cross section of a single spot is shown below. Solid line: normalized intensity profile for the cross section. Dashed line: diffraction-limited spot profile for a lenslet. (d) An even sharper spot pattern can be obtained when the beacon is focused on the disk, when the source focus was set at ~20 D. Cross section of a single spot is shown below. Solid line: normalized intensity profile for the cross section. Dashed line: diffraction-limited spot profile for a lenslet. The wavefront sensor spots are very close to diffraction-limited. (e) An OCT line scan image taken on the optic disk with a cross section on the central retinal artery. OCT signal vs. depth for the cross secion is shown below in linear scale.