
Fig. 9.
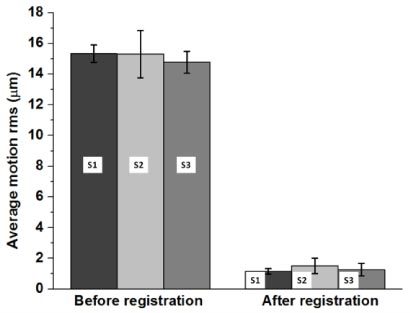
Lateral motion of the retina during UHR-AO-OCT image acquisition before and after registration/dewarping. Averages are shown for each subject (S1, S2, and S3). Each bar represents the average RMS of five cones selected in volume videos at 3°. Error bars represesent ± 1 standard deviation of the five cone measurements.